With an increased focus on retirement income, employers are now turning their attention to how their workers are using their defined contribution plan assets after terminating employment. To help organizations better evaluate the distribution decisions people make when they leave employment, Alight Solutions analyzed the post-termination behavior of more than 2 million DC participants from 2008–2017.
Data from this report can help employers benchmark their plan’s data and answer the following questions about what workers do with their retirement savings after they leave employers.
- What do people do with their balances when they terminate employment?
- What percentage of eligible assets leaves the plan?
- How do distribution decisions differ by demographics?
- Where do rollovers go?
In answering these questions, particular attention was paid to individuals who were at least 60 years old at the time of termination, since they were most likely to be considered “retired”—and DC plans at their heart are retirement plans.
About this study
This research analyzed more than 2 million participants who terminated between 2008 and 2017. Together, these individuals had account balances in excess of $100 billion. Activity was measured as of December 31, 2017 on both an asset-weighted and headcount-weighted basis to analyze the number of participants and dollars that:
- Remained in the plan;
- Rolled over to an IRA or other qualified employer plan; or
- Took a cash distribution.
Individuals who kept their assets in the plan but took installment payments were analyzed separately.
Rollovers were examined in two ways:
- How much money left DC plans through IRA rollovers versus plan-to-plan rollovers; and
- Which financial institutions received the most IRA rollovers.
The methodology section at the end provides additional detail on how individuals were categorized.
Executive summary
There is a quiet revolution happening among defined contribution (DC) plans.
According to MetLife’s Lifetime Income Poll, a seismic shift has occurred in the way employers think about their DC plans. In 2012, only 9% agreed with the statement, “The sole purpose of the DC plan is to serve as a source of retirement income.” However, by 2016, this percentage had vaulted up to 85% of employers.1
With such an increased focus on retirement income, employers are now turning their attention to how their workers are using their DC assets after terminating employment. There are many reasons for this (see the section “Why do employers care about distributions from DC plans?” below). However, it can be tough for employers to benchmark their plan’s data against other plans. To help plans better evaluate the distribution decisions people make when they leave employment, Alight Solutions analyzed the post-termination behavior of more than 2 million DC participants. This paper is a follow-up to Alight’s June 2017 report, entitled Benchmarking 401(k) Rollover Behavior, and helps answer the following questions:
- What do people do with their balances when they terminate employment? Do they keep their money in the plan, cash it out, roll it over to an IRA or another employer’s plan, or some combination of the three?
- What percentage of eligible assets leaves the plan? While knowing what individuals are doing with their accounts is important, looking solely at headcount may provide a skewed perspective because typically there are more people with smaller balances than with larger ones.
- How do distribution decisions differ by demographics? This paper takes a deeper dive beyond the averages to examine the impact of variables such as age, balance size, time since termination, and the prevalence of plan provisions like partial distributions and installment payments.
- Where do rollovers go? Plan sponsors should know where the money goes when workers roll balances over to an IRA. To this end, our paper presents some benchmarking information on how much IRA providers receive from rollovers.
In answering these questions, particular attention was paid to individuals who were at least 60 years old at the time of termination, since they were most likely to be considered “retired”—and DC plans at their heart are retirement plans.
Examining these questions yielded four key findings:
- Many people kept their money in the plan—especially individuals with large balances. Among participants who terminated over the past 10 years, 40% of assets remained in the plan as of year-end 2017. But because individuals with smaller balances were more likely to cash out, only 26% of the people who terminated over the last 10 years remained in the plan at the end of 2017.
- Plan provisions that enable retirement strategies from DC plans increased post-termination asset retention. Participants who were age 60 or older when they terminated were more likely to keep their assets in the plan if installment payments were offered.
- Alight Solutions had higher asset retention than other recordkeepers. In 2017, 10% of balances for terminated participants were rolled into IRAs from plans on Alight’s recordkeeping platform. This is much lower than the 25% figure quoted across the industry.2 Unlike most other DC recordkeepers, Alight does not have an IRA rollover line of business that seeks to convert participants from institutional DC plans into retail investment vehicles. This factor may be a contributor to the higher asset retention rate of Alight’s plans compared to others.
- No single IRA provider received a very large percentage of rollovers. The IRA rollover market is highly competitive and crowded. Alight’s analysis found that more than 5,000 different IRA providers have received IRA rollovers over the past 10 years. With such a congested market, it’s no surprise that no one IRA provider received a majority of the distributions.
Why do employers care about distributions from DC plans?
In Alight’s experience, employers carefully review how money is leaving their DC plan for several reasons. Three of the most common motives are:
- Fiduciary duty. The fiduciary duties under ERISA apply to all participants in the plan, whether they are actively employed or terminated. Recent headlines show that the Department of Labor has been investigating the rollover practices of a large financial services institution that has a 401(k) recordkeeping service to determine whether the institution was steering individuals from low-cost 401(k) plans to higher-cost IRAs. This story served as a wake-up call for many in the industry to see if their participants might be receiving similar advice.
- Fees. A large exodus of dollars leaving the plan can negatively affect the plan sponsor’s ability to obtain and maintain optimal pricing from asset managers, trustees and some plan recordkeepers. To the extent the plan’s collective purchasing power is eroded, this could ultimately result in higher fees for all participants. Knowing how much money is leaving the plan and understanding the factors that influence those decisions enables employers to better anticipate any changes to their plan.
- Consistent messaging. Employers spend countless hours trying to encourage workers to participate in the plan and save for the future. Over the last decade, many employers have also added automatic features to ensure that workers must take active elections not to participate in the plan. The message has been clear: Participating in the plan is important. To many of these employers, it seems out of step to stop communicating that message once a worker is no longer employed. This is especially true when many of the most compelling benefits of participating in the plan—like fiduciary protection and low-cost investment options—are still available to inactive participants.
Most participants who terminated employment left the plan
As of year-end 2017, only about one-quarter of all workers who terminated employment between 2008 and 2017 kept their money in the plan.3 Four out of every 10 people cashed out their entire balance, and another 26% rolled their balances over to another qualified plan. The remaining 8% of individuals had a combination of distribution activities; for example, taking only a portion of the balance as a withdrawal.
Percentage of people by distribution category for individuals who terminated 2008–2017

A starkly different picture emerges when examining data on an asset-weighted basis rather than by headcount. The percentage of assets that left the plan by year-end 2017 dropped to 60%, and cash-outs accounted for only 15% of the total money.
Percentage of assets by distribution category for individuals who terminated 2008–2017

People with small balances were most likely to cash out
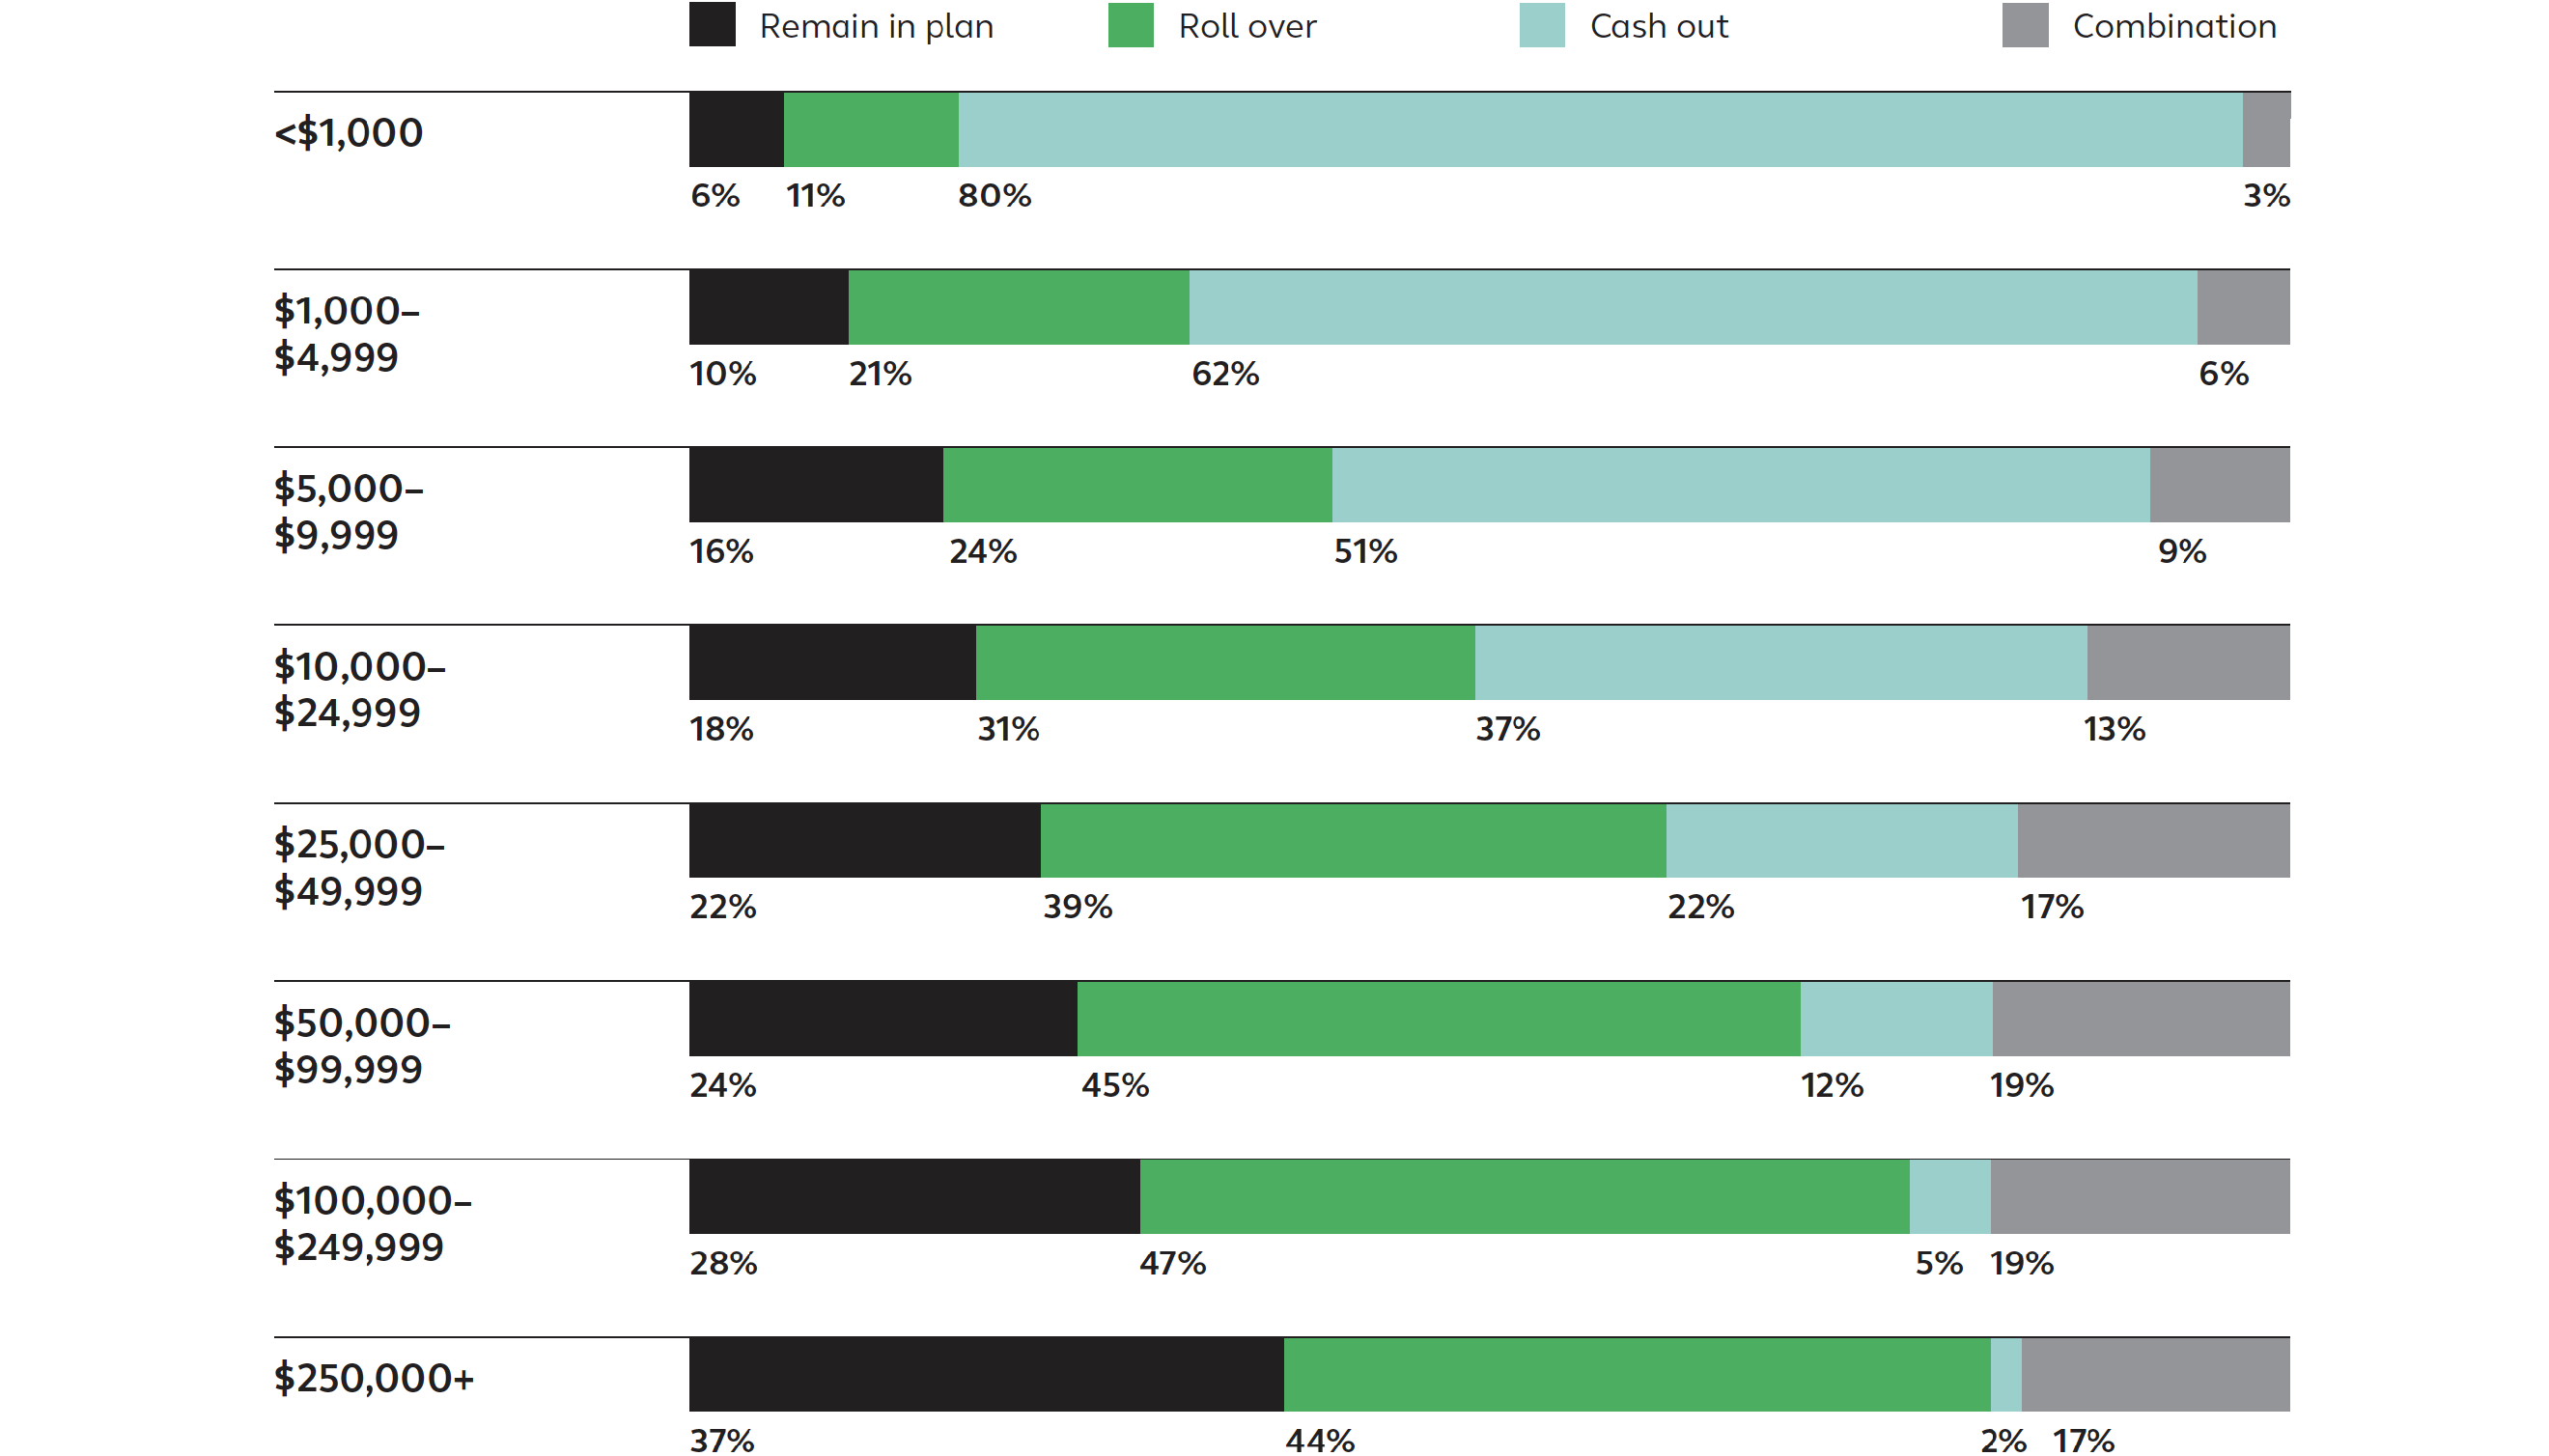
The discrepancy between the headcount and the asset weighting arises from two primary facts. First, people with small balances were more likely to cash out their benefits than people with large balances—80% of people with balances of less than $1,000 cashed out their entire balance, compared to only 2% of people with balances of $250,000 or more. Second, there are many more people with small balances than with large ones. Individuals with balances of $1,000 or less outnumbered those with balances of $250,000+ by a factor of more than 3 to 1.
Percentage of participants by balance size and distribution category
People were most likely to take a withdrawal soon after terminating
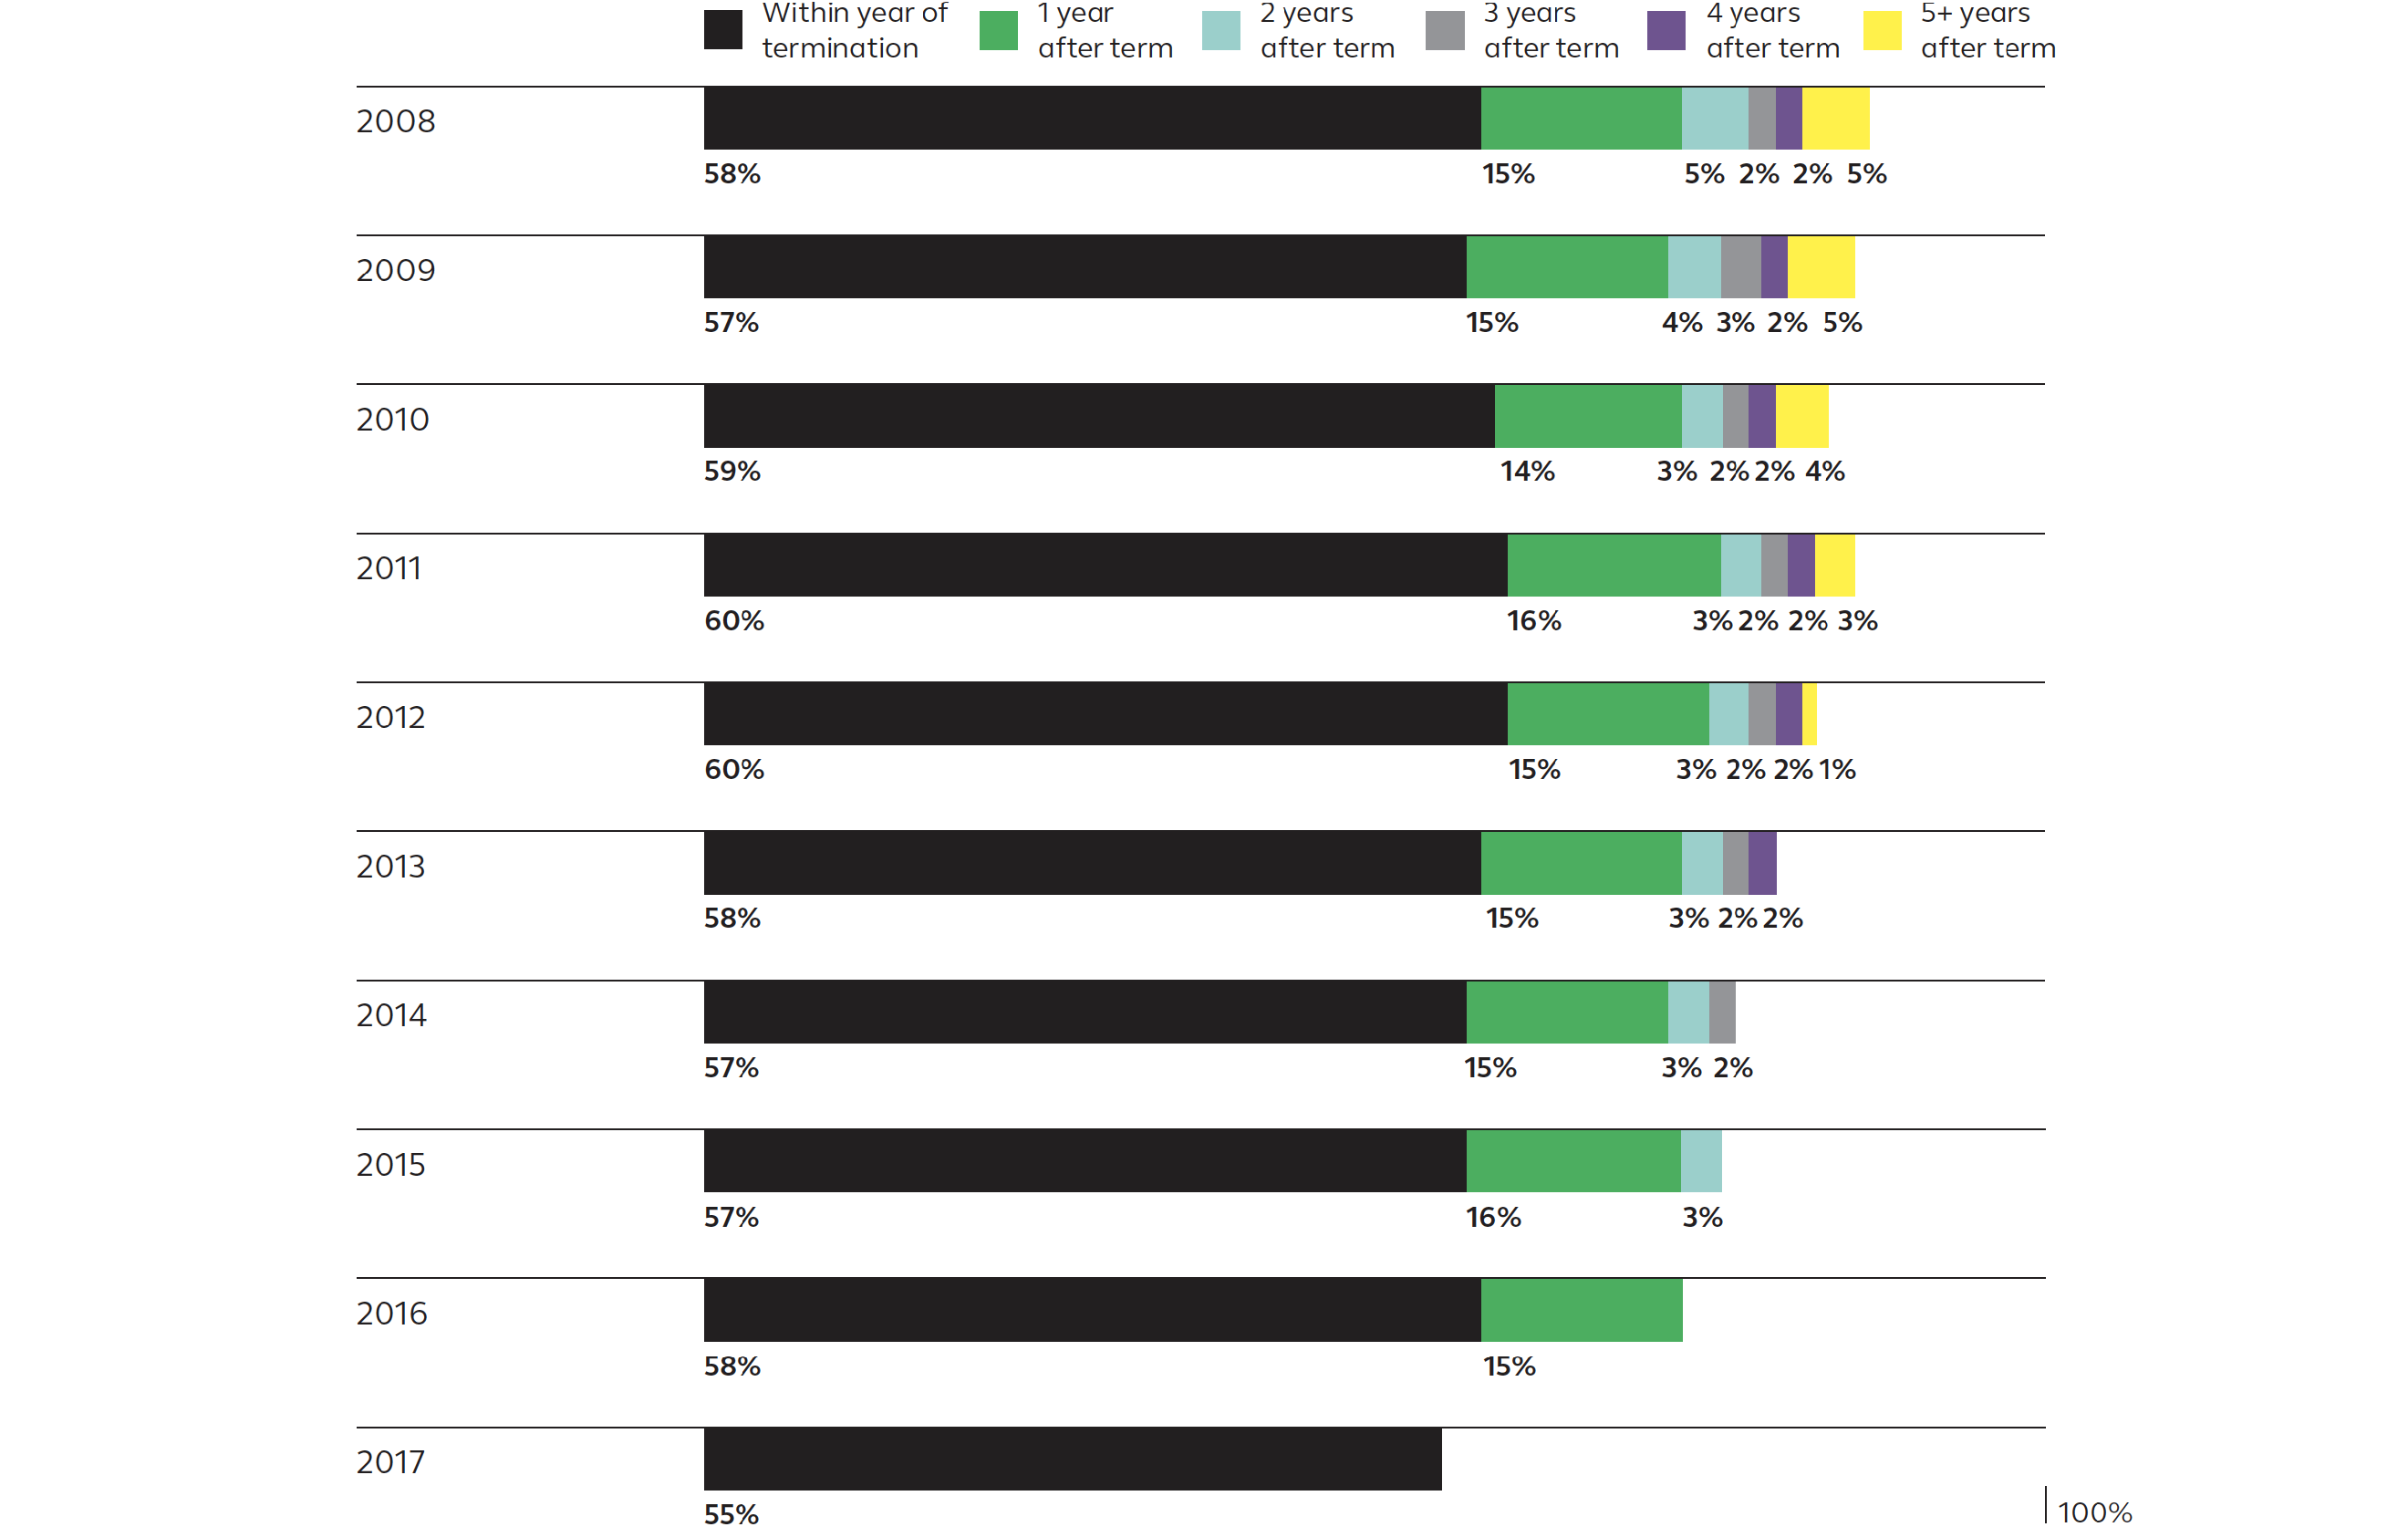
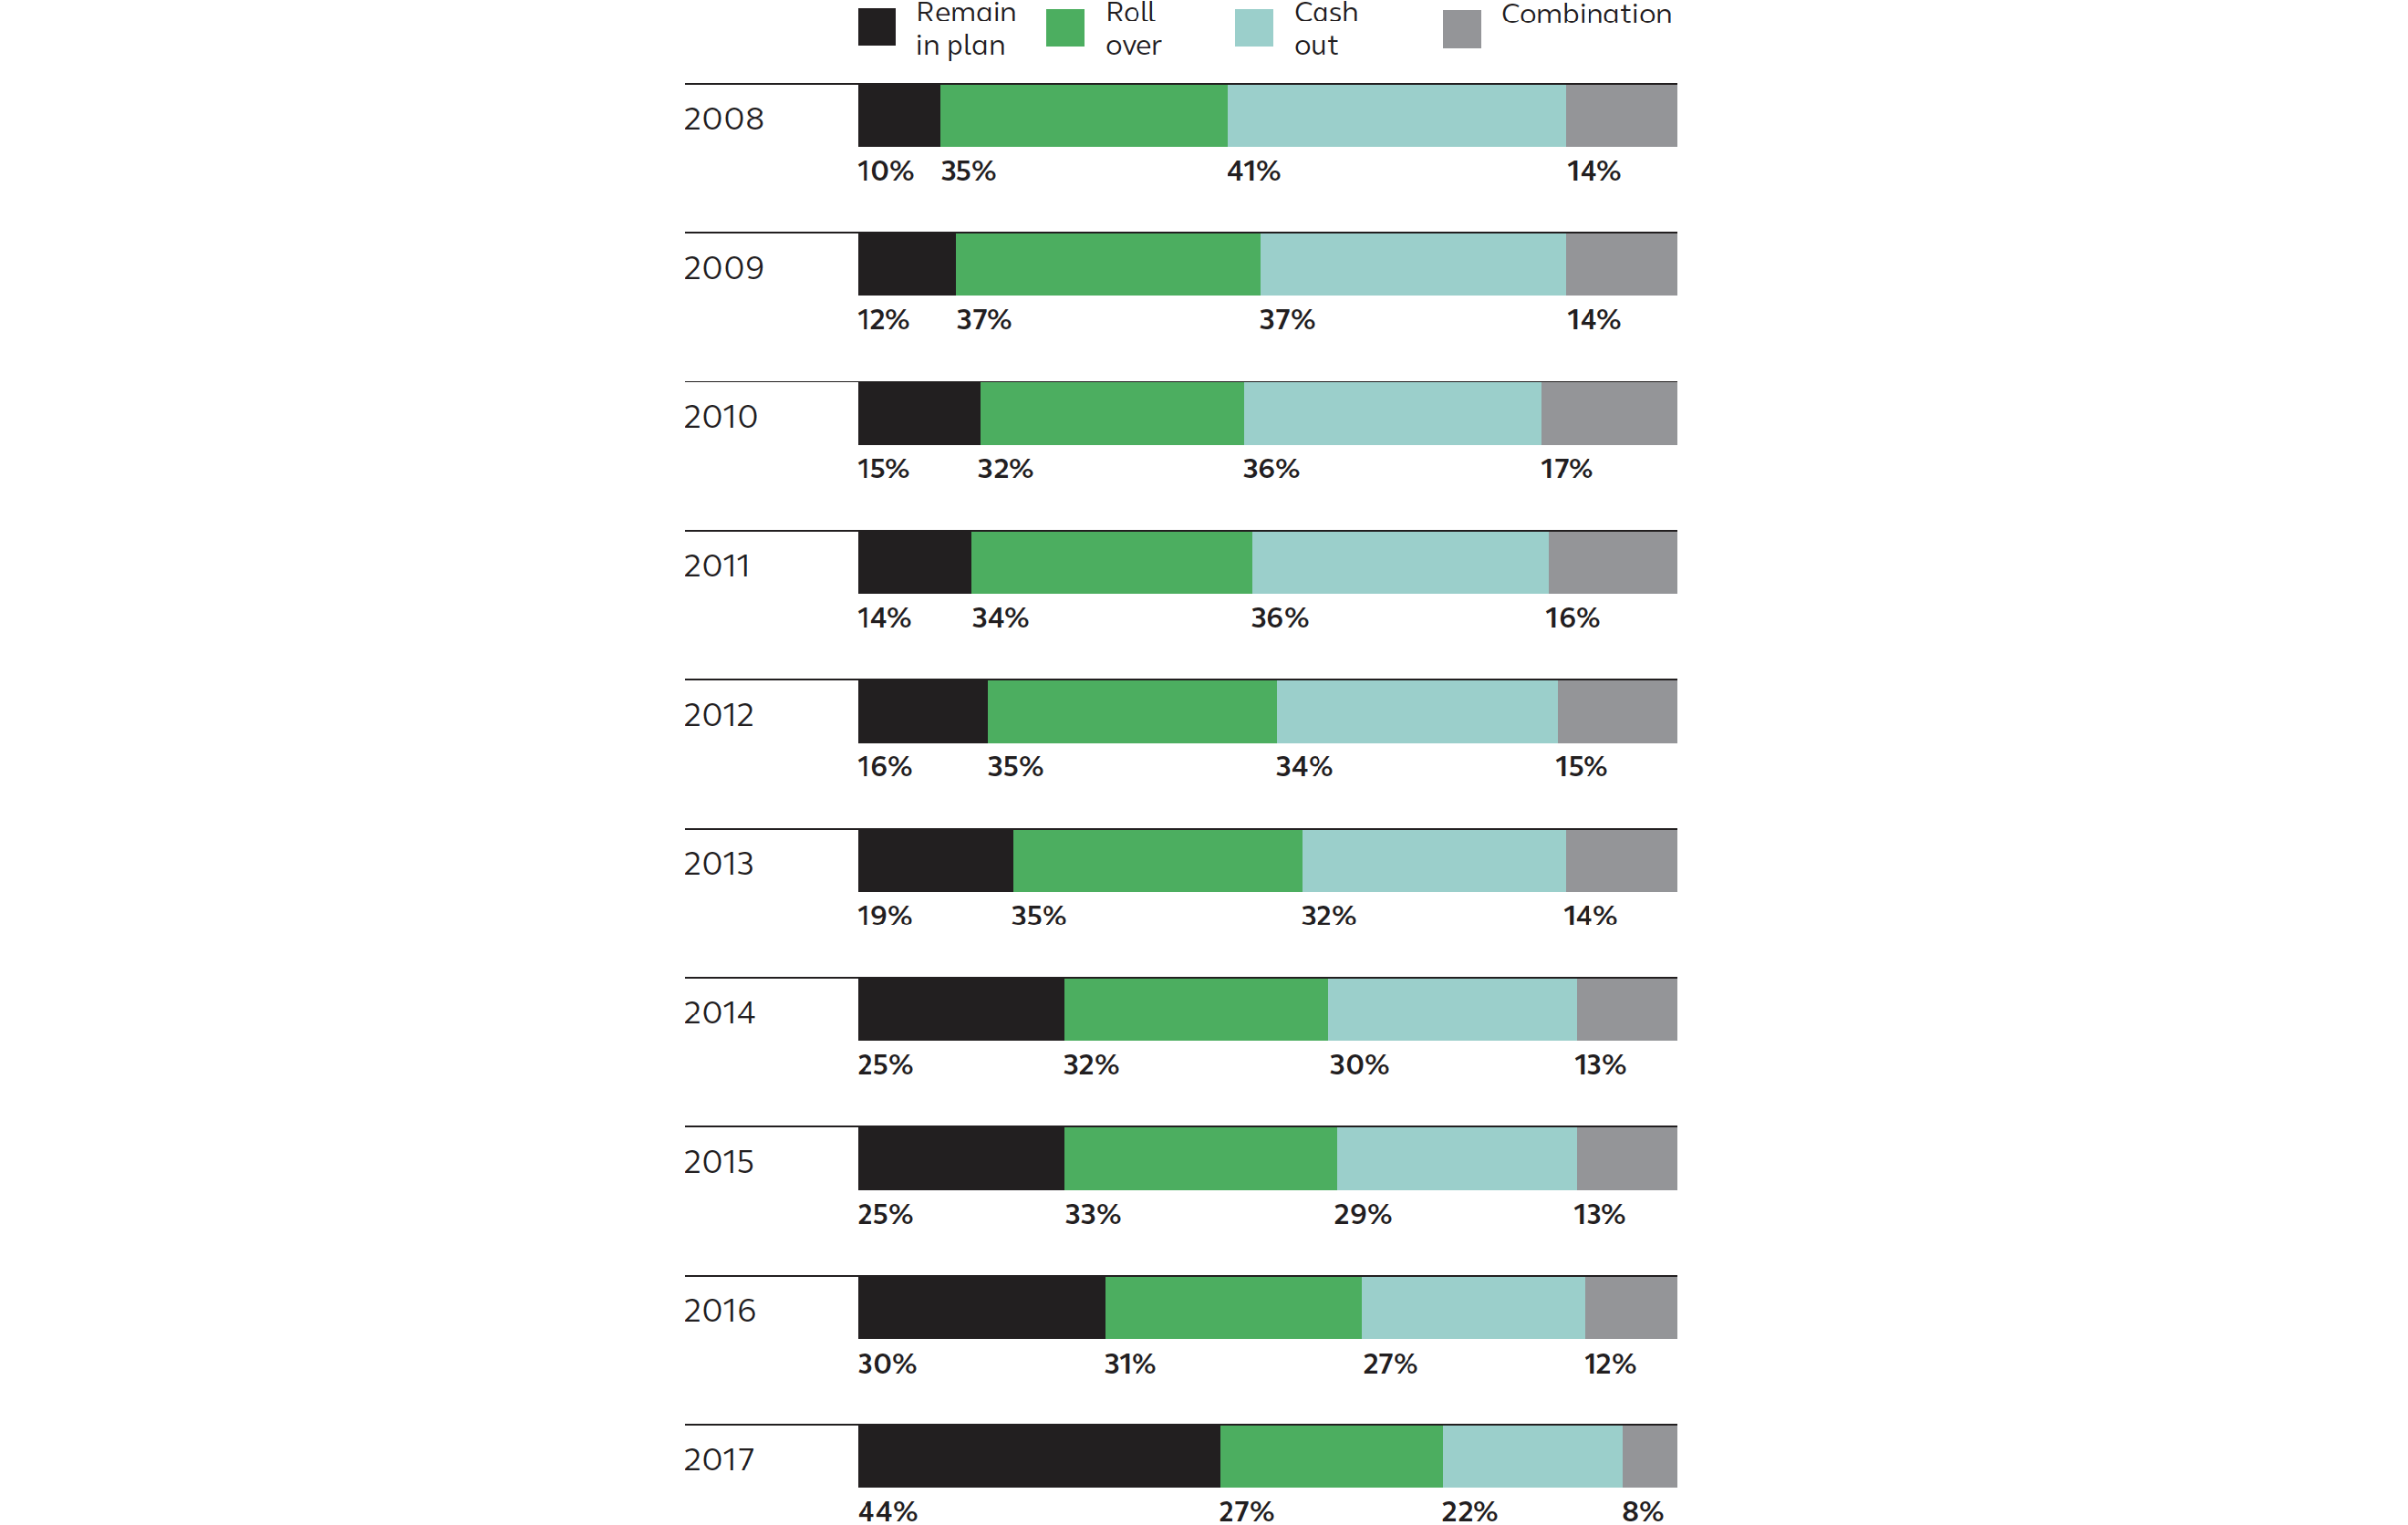
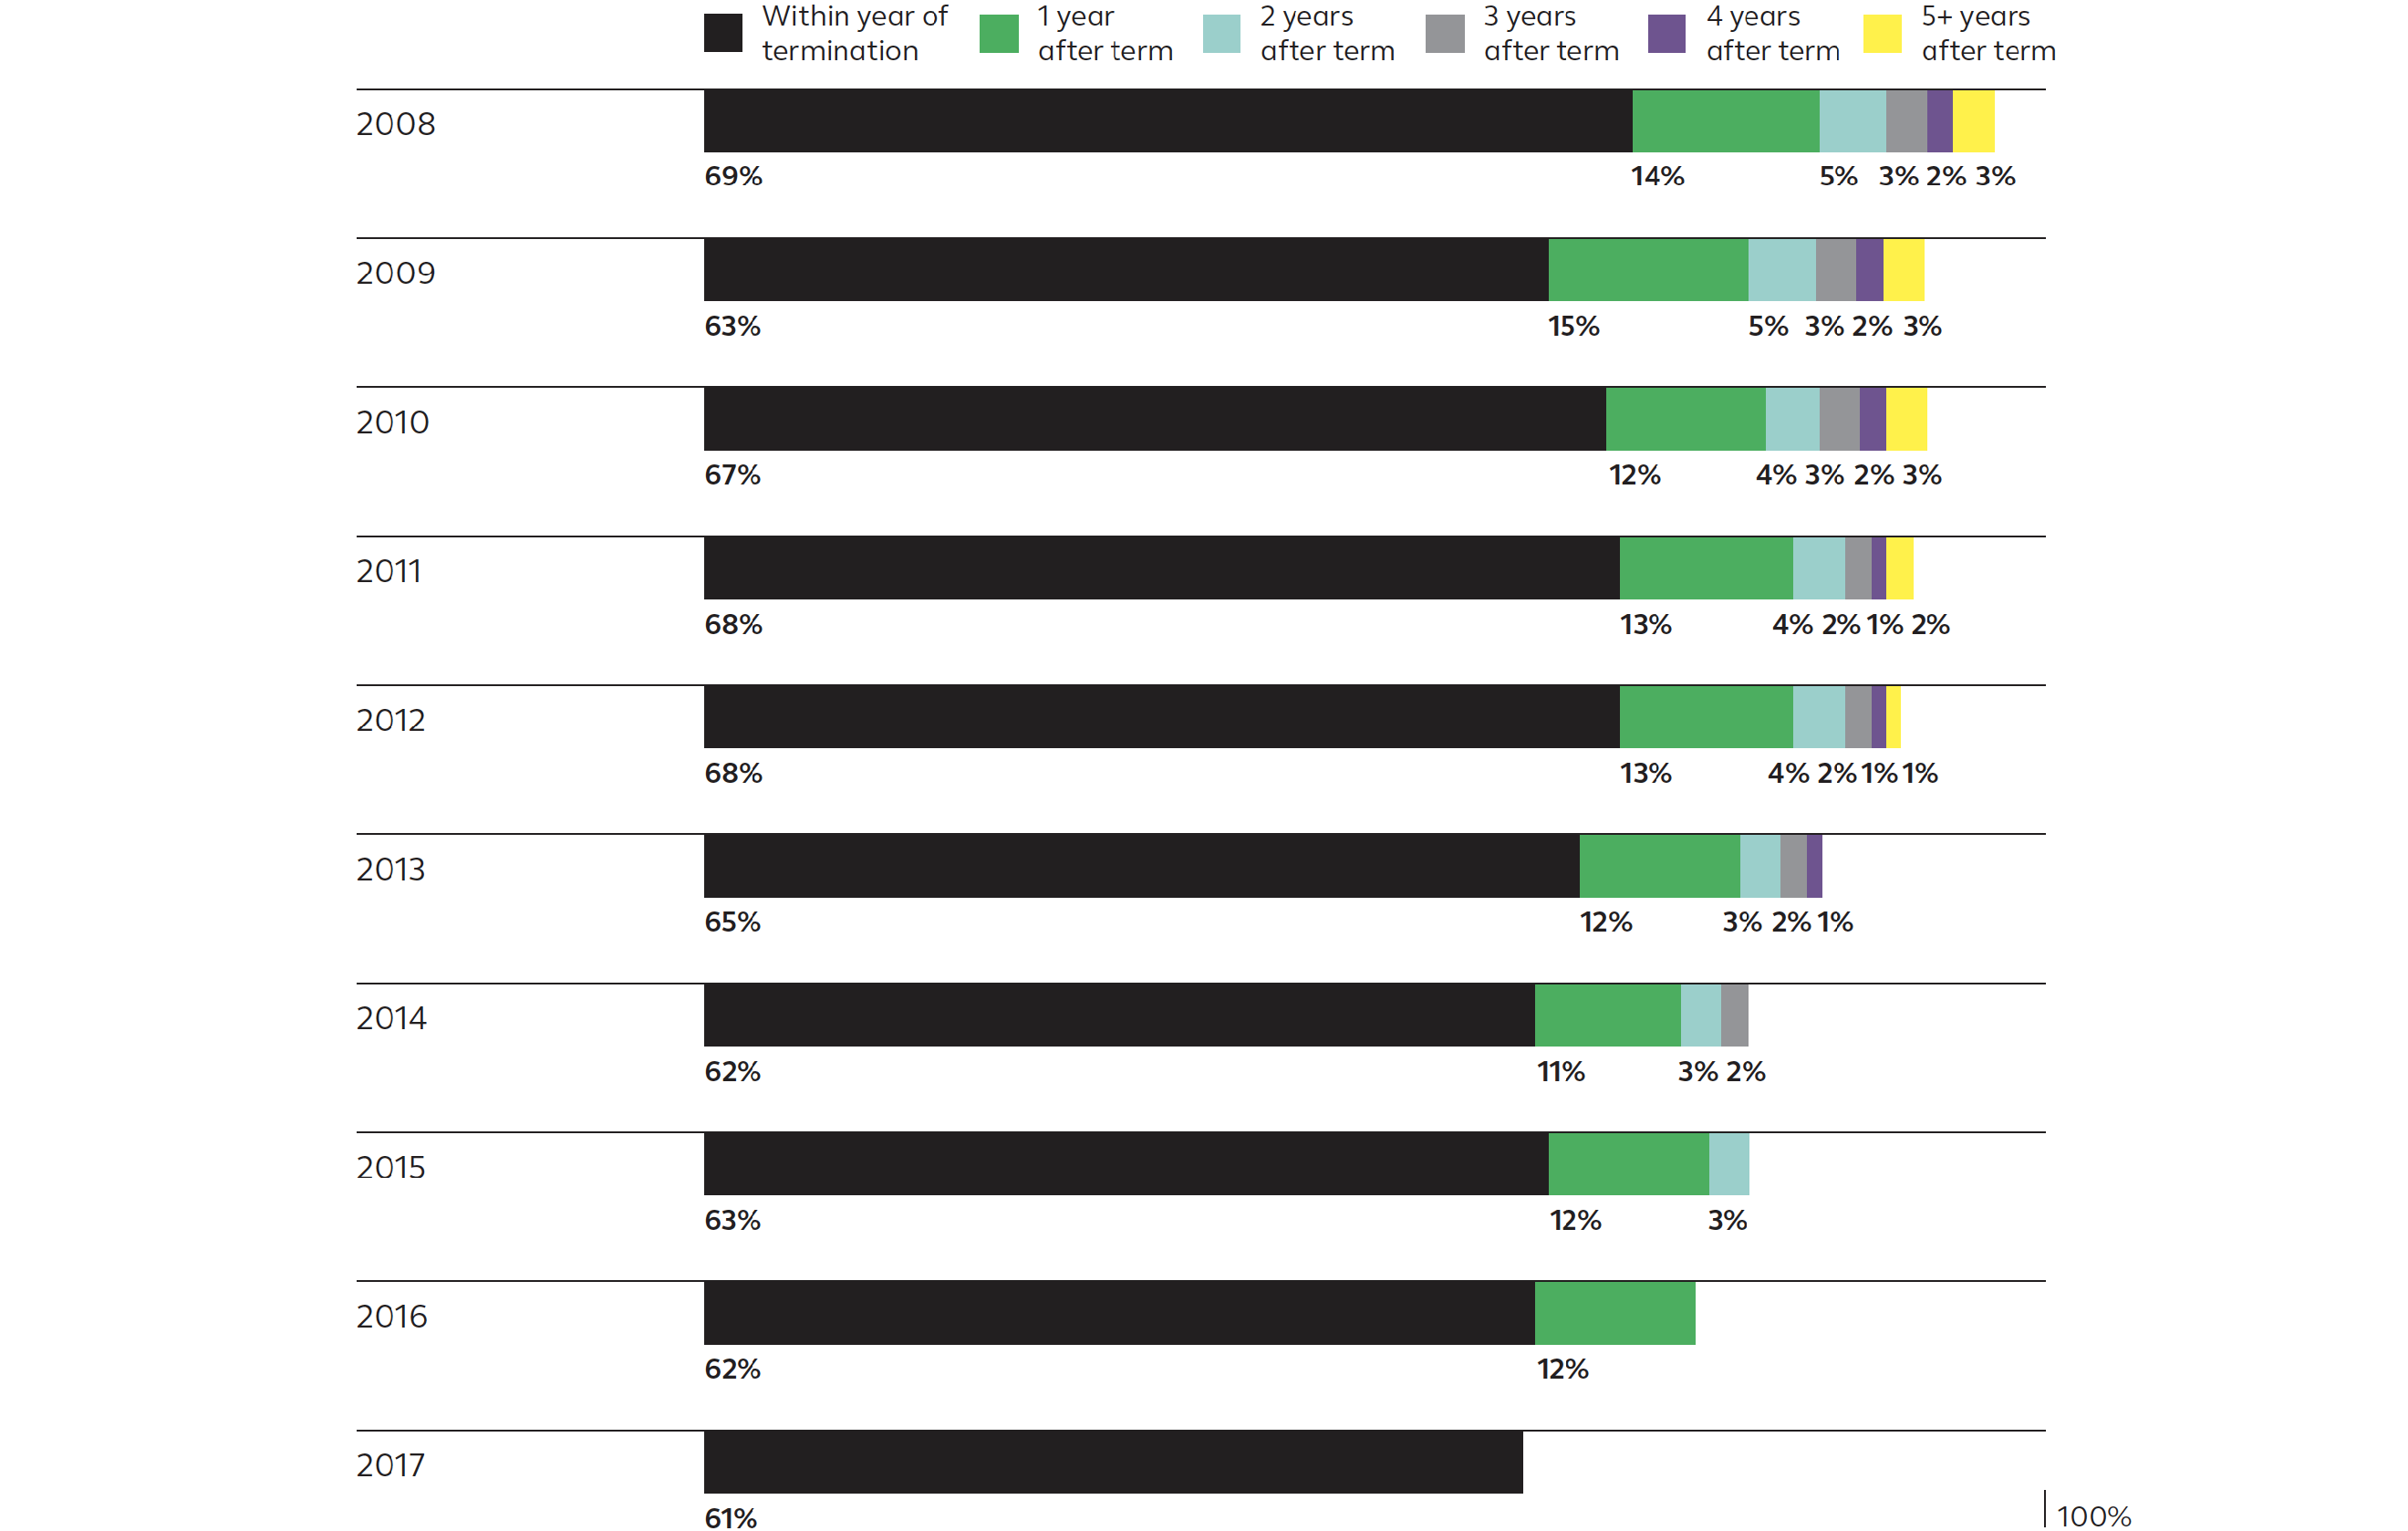
There has been remarkable consistency in the withdrawal behavior of participants over the past 10 years. Within the year of termination, 55% to 60% of people took a withdrawal, either through a cash-out or a rollover. In the year following the termination year, another 15% took action. All told, roughly three-quarters of people took a distribution by the end of the calendar year following their termination date. But after two years, people became much less likely to start tapping their balances.
Percentage of people taking a distribution by 12/31/2017 by termination year and number of calendar years following termination
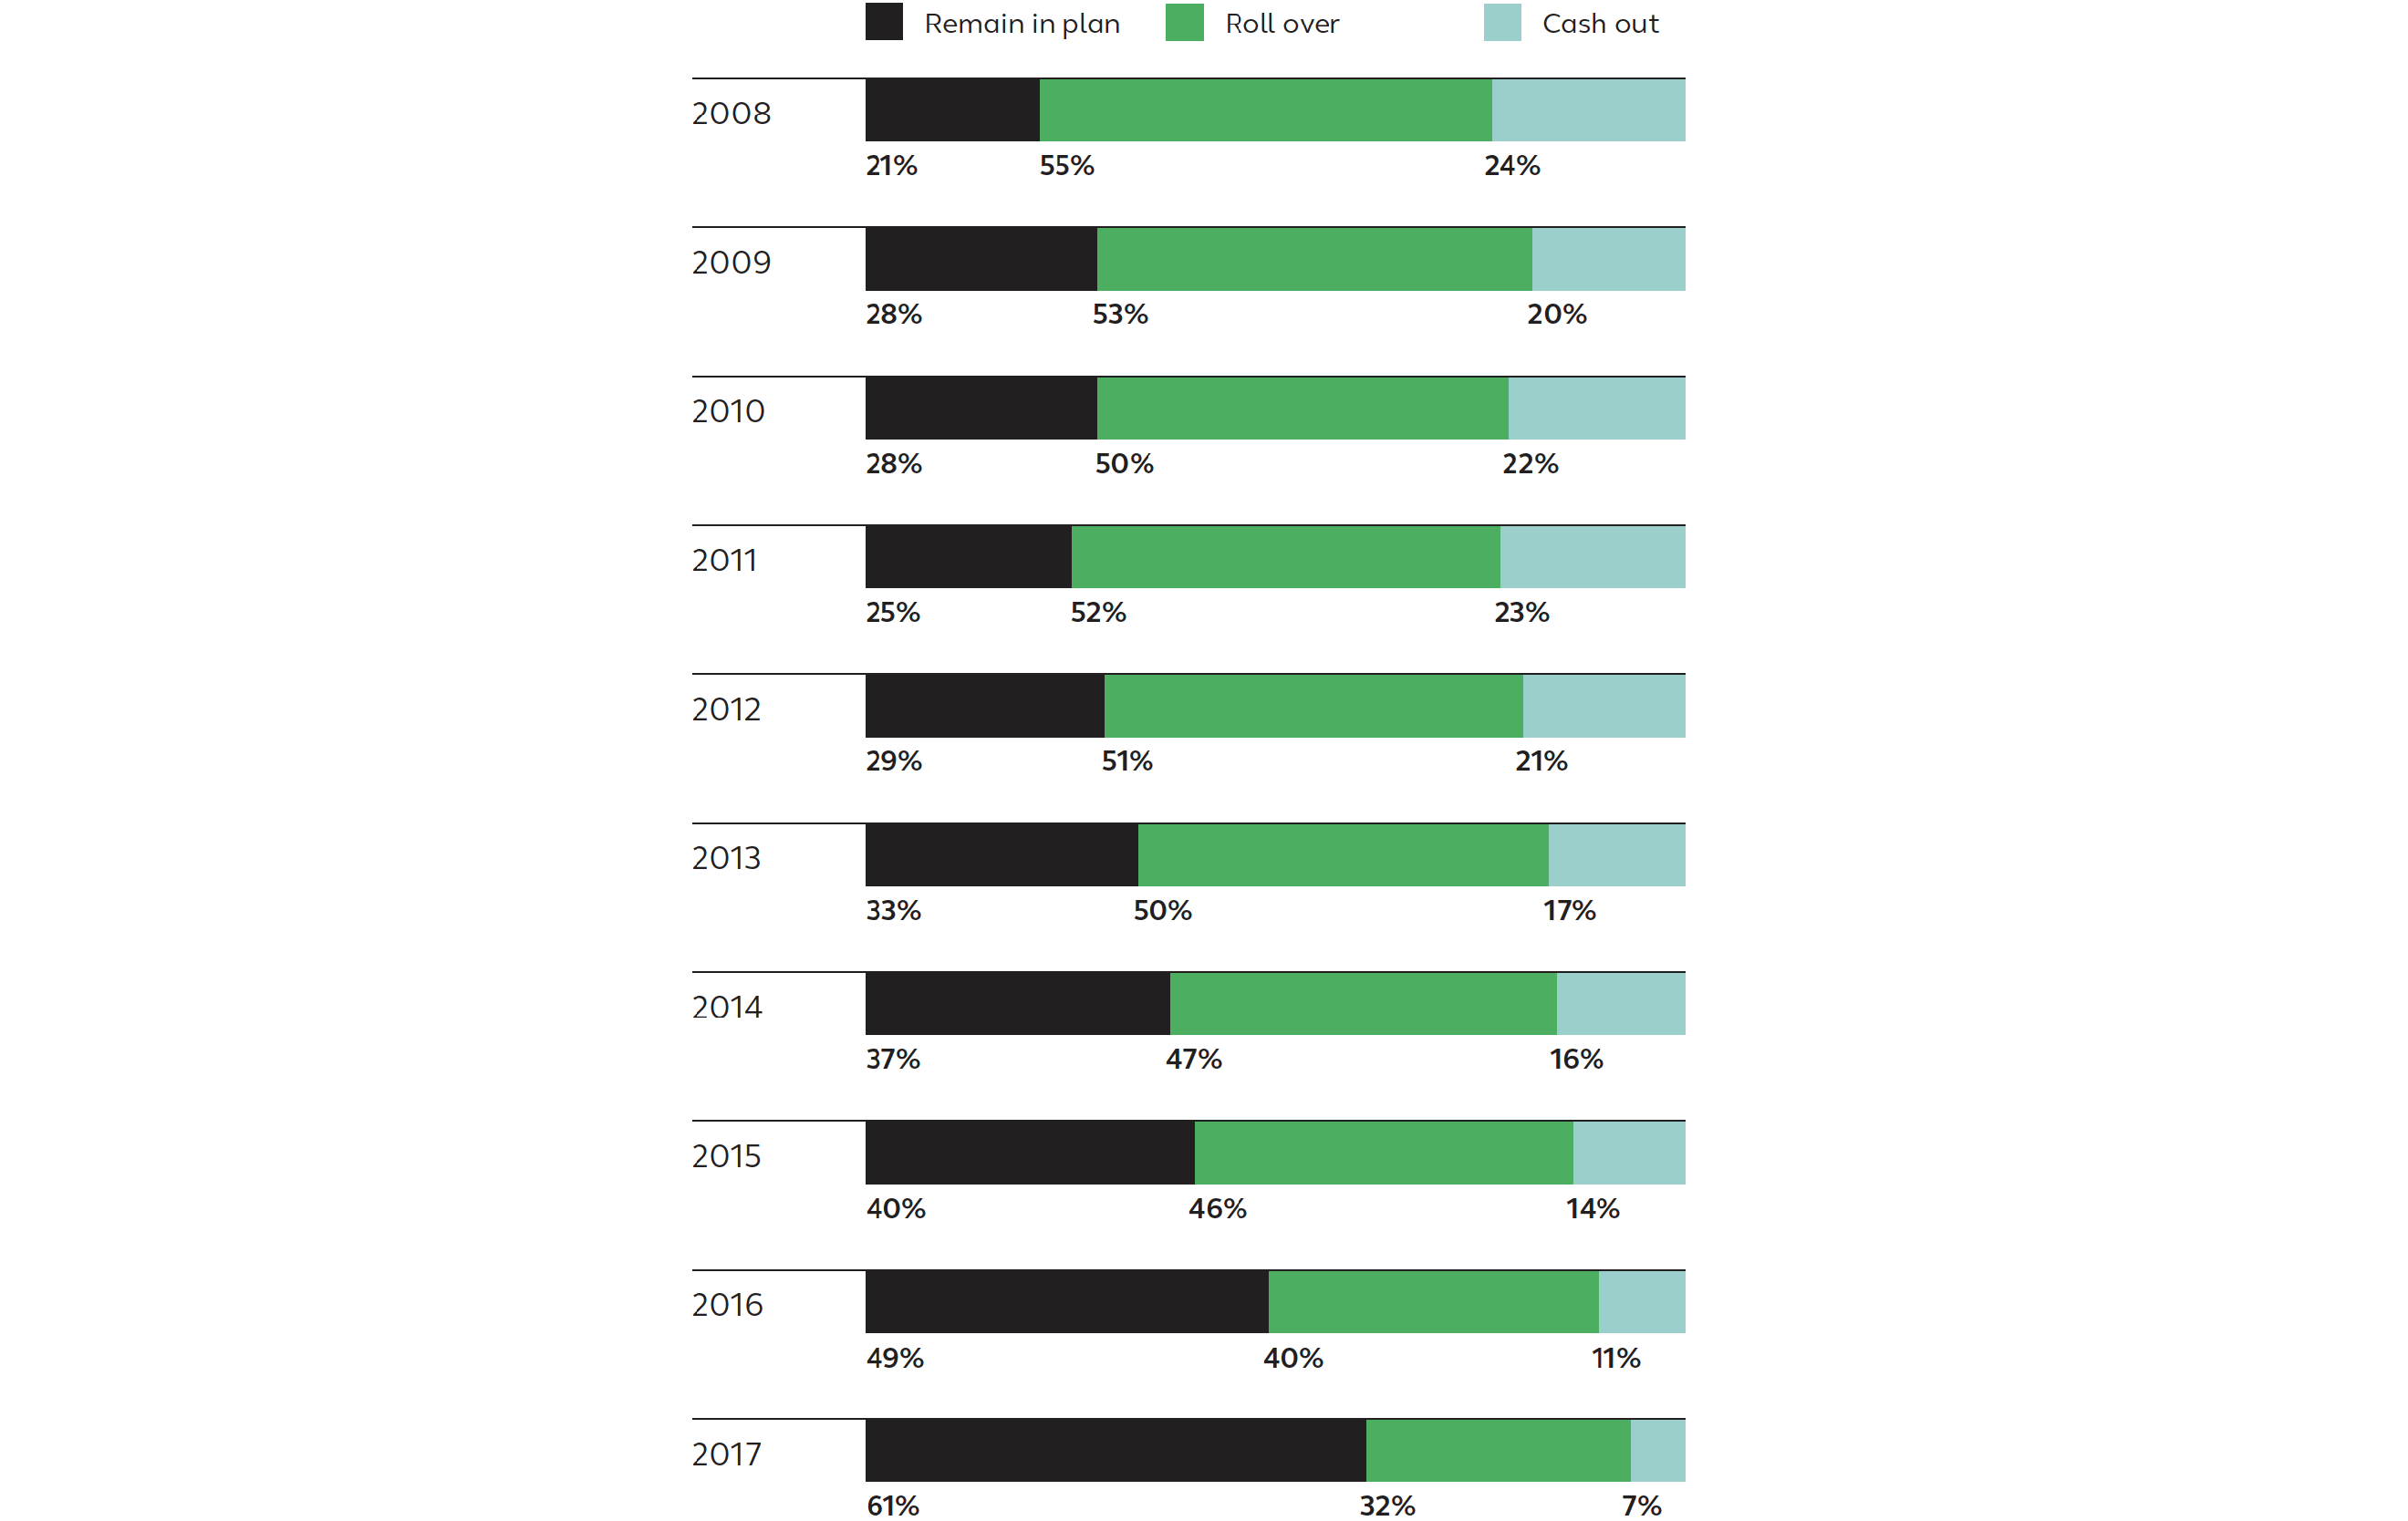
Assets leaving the plan followed a similar pattern. Most of the withdrawals took place within the first few years following termination, but slowed down and leveled off after about five years.
Percentage of assets as of 12/31/2017 by termination year and distribution category
Percentage of participants as of 12/31/2017 by termination year and distribution category
Retirees were more likely to withdraw their money following termination
Overall, there was a higher percentage of withdrawals among people who terminated employment after reaching age 60 than among other age groups. However, it should also be noted that people over age 60 were the most likely to use a combination of distributions. Some of these people took cash distributions of less than 100% of their account while keeping the rest in the plan. Although there is no way to determine from the data the reasons behind these distributions, it is reasonable to infer that some of these cash distributions may have been used for retirement income purposes.
Percentage of participants by age and distribution category

Percentage of dollars falling under category by 12/31/2017 by age and distribution category

Percentage of participants taking a withdrawal4 by 12/31/2017 by termination year and number of calendar years following termination
Retirees were more likely to keep their money in the plan when installment payments were offered
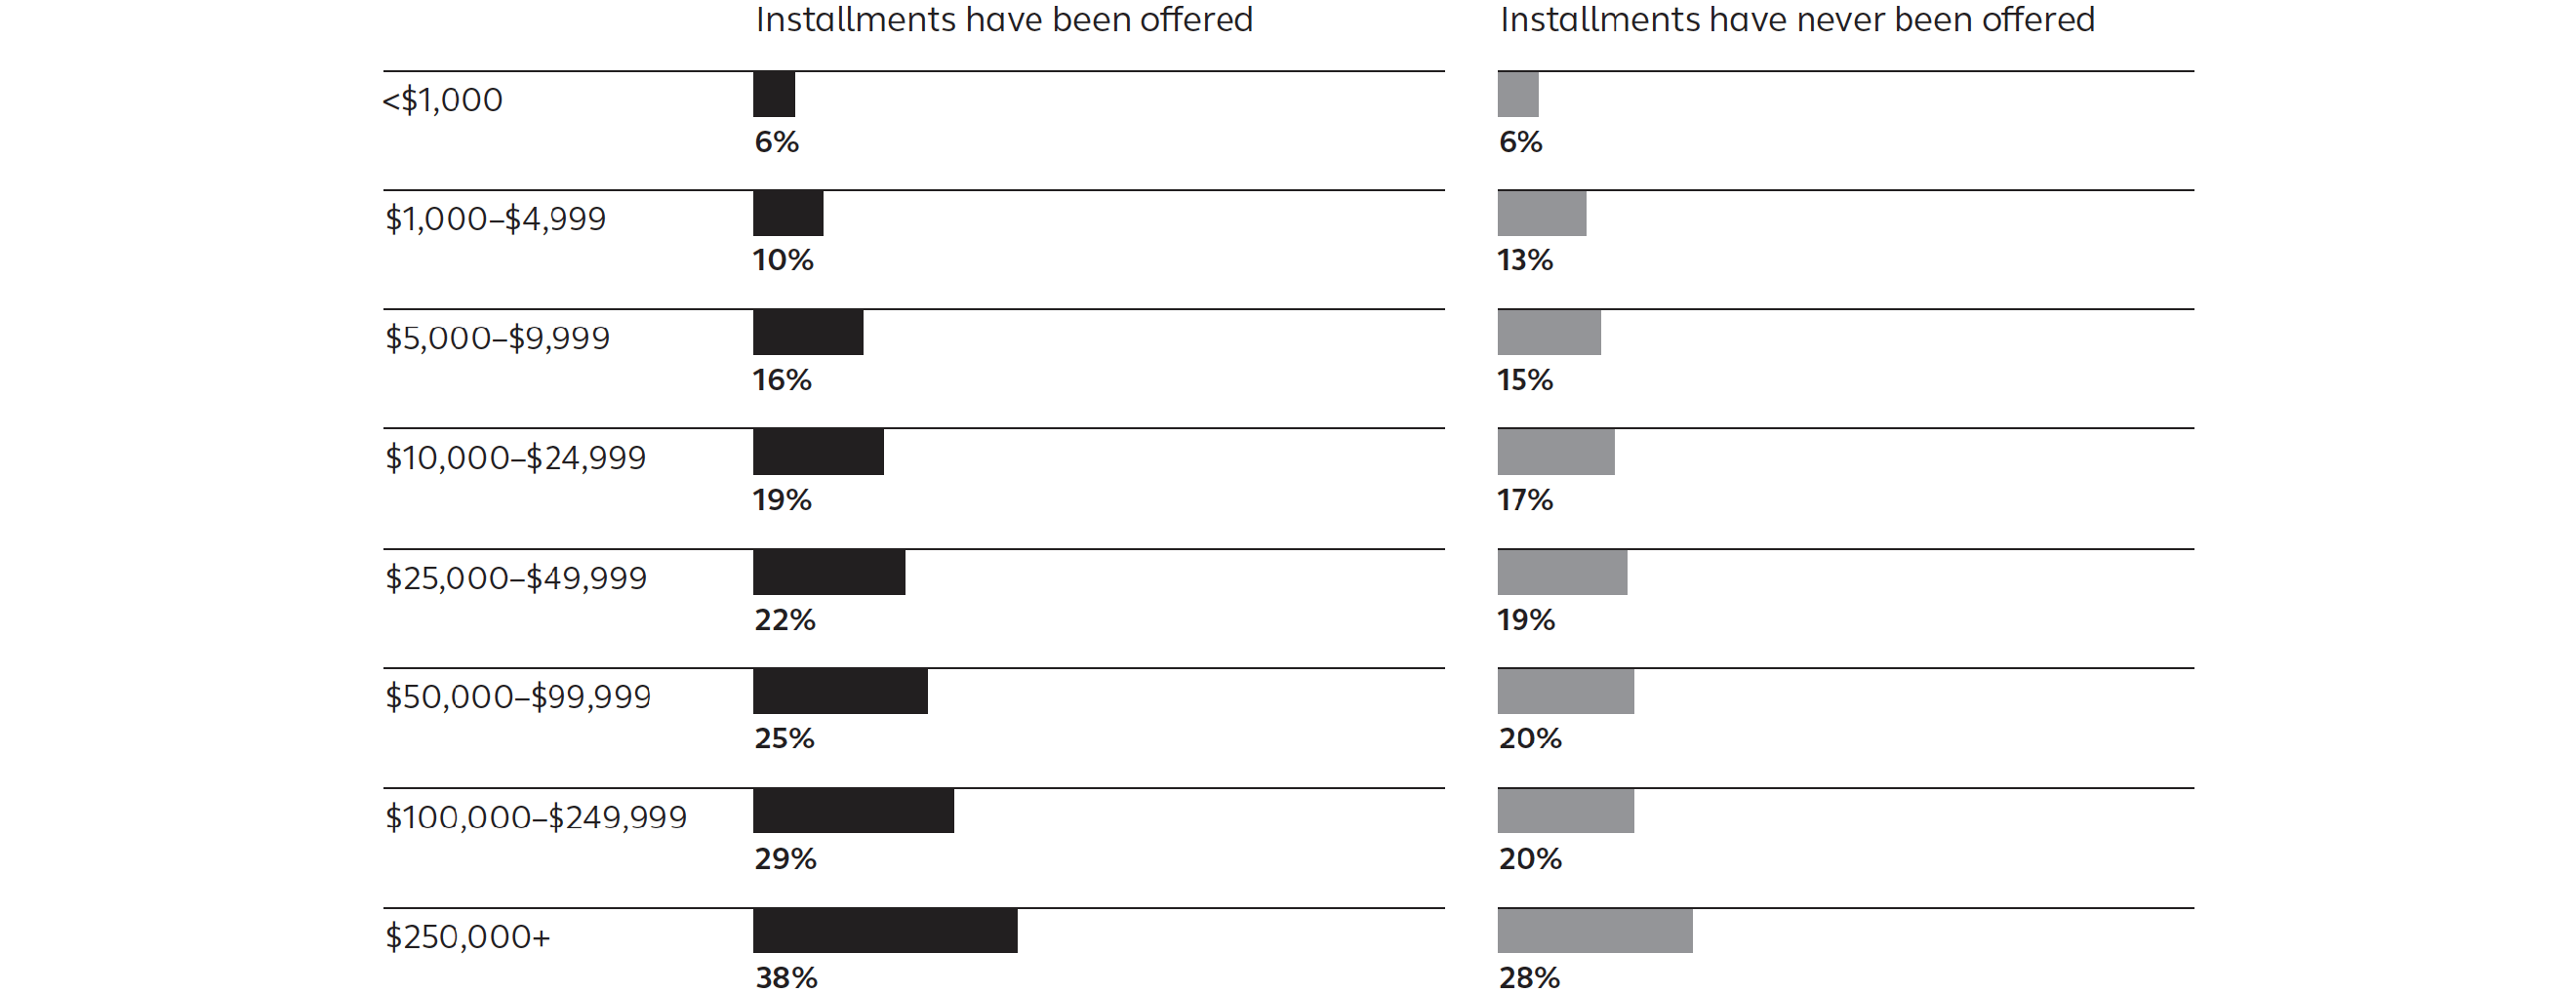
When installment payments were available as a distribution option, retirees kept more assets in the plan. Retirees with larger plan balances were especially likely to remain in the plan: 38% of people who terminated after reaching age 60 and who had a balance of at least $250,000 kept their money in the plan when installments were offered. When installment payments were not offered, only 28% of these individuals kept their money in the plan.
This finding makes intuitive sense: People who have accumulated a large balance over their career with their employer’s DC plan may well have developed a high level of comfort and trust in that relationship. Also, the stable value asset class is perhaps of greatest value to participants in retirement, and those funds are available only in DC plans—not IRAs or other account types.
Percentage of dollars falling under category by 12/31/2017 by installment offering and distribution category

Percentage of participants remaining in the plan by 12/31/2017 by balance size and installment offering
How popular are installment payments in plans?
DC plans are increasingly making it easier for people to access their plan balances as a source of income. According to Alight’s 2017 Trends and Experience in Defined Contribution Plans survey, two-thirds of plans allow individuals to receive their payment in automatic installments—a notable increase from 51% in 2007.
However, adoption of installment payments has been slow among participants. Annually, only 3% to 6% of people who terminated after age 60 chose an installment payment. Cash distributions and rollovers were much more common.
Even among individuals with large balances, installments are unpopular. Just 5% of workers who terminated at age 60 or later with a balance of at least $250,000 took an installment payment when it was offered. Among these, 72% ended up taking another partial distribution or a full distribution.
Alight had a lower percentage of dollars flowing to IRAs than other DC recordkeepers
In 2017, only 10% of Alight clients’ eligible assets were rolled into IRAs. This number is materially lower than that reported by other companies. For example, according to Cerulli Associates, 25% of eligible assets in 2017 were rolled over to IRAs.5
Additionally, Vanguard states that 59% of participants who terminated on or after age 60 had rolled their money out of the plan within 10 years of terminating.6 Among Alight clients, just 35% of these individuals took a rollover within 10 years.
It should be noted that Alight is expected to have a lower percentage of IRA rollovers than recordkeepers that offer IRA products to individuals, since Alight does not engage in that practice. As the Government Accountability Office has reported, people “often receive guidance and marketing favoring IRAs when seeking assistance regarding what to do with their 401(k) plan savings when they separate from their employers,” and it is not uncommon for recordkeepers’ call center representatives to encourage individuals to roll their 401(k) plan savings into an IRA, even with only minimal knowledge of a caller’s financial situation.7
According to a Hearts and Wallets study, people are inclined to roll their balances into an IRA account run by their 401(k) recordkeeper. They found that 55% of accounts with less than $25,000 in assets rolled their money into an account with their 401(k) administrator. Among accounts of at least $100,000, 32% of people use their 401(k) provider’s IRA, and for accounts with $500,000 or more in assets, 24% of people went with the same provider.8
These numbers are much higher than what Alight’s data shows. Across all plans and balance sizes we studied, the most common IRA destination collected only 17% of IRA rollover dollars. While this is significantly more than the next most popular destination (which collected 8% of IRA rollovers in 2017), it still represents less than one out of every five dollars rolled over from the plan. Overall, Alight’s data shows that more than 5,000 different providers have received rollovers. With such a crowded marketplace, it is not surprising that no one provider receives a majority of the rollovers.
Finally, few rollovers from DC plans went to other employer-sponsored plans. Among 2008–2017 terminated participants taking a rollover distribution by December 31, 2017, the dollars rolled over to IRAs outnumbered the dollars rolled over to other qualified plans by a factor of roughly 10 to 1. This is perhaps unsurprising, given the massive marketing efforts of the financial services industry to attract customers’ assets versus the virtually non-existent efforts of DC plans to promote plan-to-plan rollovers.
Destination of IRA rollover dollars by year

Recommendations for employers
Employers can use the data and information in this paper in several ways to help improve their DC plans’ performance:
Benchmark the data. Alight believes the benchmarks set forth in this paper serve as fair guideposts for employers that wish to compare their plans to other employers’ plans. Specifically, employers can:
- Compare the percentage of assets being rolled over into IRAs—does the plan have significantly more or less dollars going to IRAs than others? If so, is there a good justification for that?
- Compare the percentage of IRA rollovers going to individual providers— does the plan have a substantial amount of IRA rollovers going to a specific IRA provider? Are there relationships between providers and the company that could impact IRA rollovers? If so, are employers responsible for any decisions that could have influenced this relationship? Because it is not clear whether this activity is in the best interest of the participant or the provider, we recommend that employers pay close attention to their plans’ rollover activity.
Educate participants about their retirement plan choices. After leaving an employer, people can be overwhelmed with the number of choices available to them for their savings. Employers can help explain the pros and cons of the different approaches to new hires as well as those leaving employment.
- Discourage non-retirement income cash distributions—people with lower balances are more likely to take full cash distributions, but the overall effect on retirement income adequacy can be damaging. For instance, a cash distribution of $25,000 taken by a 30-year-old could produce $200,000 in retirement.9
- Bolster financial wellness offerings for current workers—emphasize the importance of earmarking the DC plan balance for retirement savings.
Encourage retirement income. With defined contribution plans forming the backbone of retirement savings, there are several steps employers can take to help people use their savings for income throughout retirement.
- Allow for lifetime income options—a simple start could be to allow for partial distributions and installment payments, but to be open to other emerging, less traditional options as well. Giving people the choice to use in-plan distribution options can help curtail the outflow of money from the plan.
- Start the process early—empower your near-retirees to make sound decisions by giving them helpful education and tools, and ensure that plan participants are versed in their distribution alternatives well before their actual retirement dates.
As employers shift their focus on DC plans from an accumulation vehicle to one that provides retirement income, it is important to monitor the distribution decisions of the plan participants. Alight believes that the information provided in this paper can help employers with this initiative.
Methodology
Measuring the percentage of money distributed from accounts over a long period can be challenging, particularly when people take multiple payments of different types over time. For purposes of the numbers shown in this paper, Alight calculated the percentage of balance by assuming annual withdrawal amounts to have occurred at the end of the year in which they were withdrawn. Alight then calculated the overall percentage of balance that remained in the plan after termination by compounding the percentage remaining in the plan during each year. The complement to this was the percentage that was distributed over time.
Alight followed this same process to calculate the ungrossed percentages that were paid out as IRA rollovers, cash distributions, plan-to-plan rollovers and installment payments. In some cases, multiple payments of different types were taken over time and the percentages did not sum to 100%, so we grossed up the percentages proportionally based on the total percentage withdrawn over time.
Individuals were then classified into headcount categories based on where they had the majority of their dollars. Specifically, Alight used an 80% threshold to classify the participants. If no category had at least 80%, then that person was classified as “combination.” In the example above, since all percentages are less than 80%, Roger falls into the “combination” category.
Participants remaining in the plan but taking installments were those who had at least 80% of dollars remaining in the plan, excluding installments. Alight assumed that installments for this purpose were any payments categorized as installments, dividends or required minimum distributions that were below 20% of a participant’s balance.
Charts showing participant behavior by balance size used the balance as of the beginning of the year before the termination date.
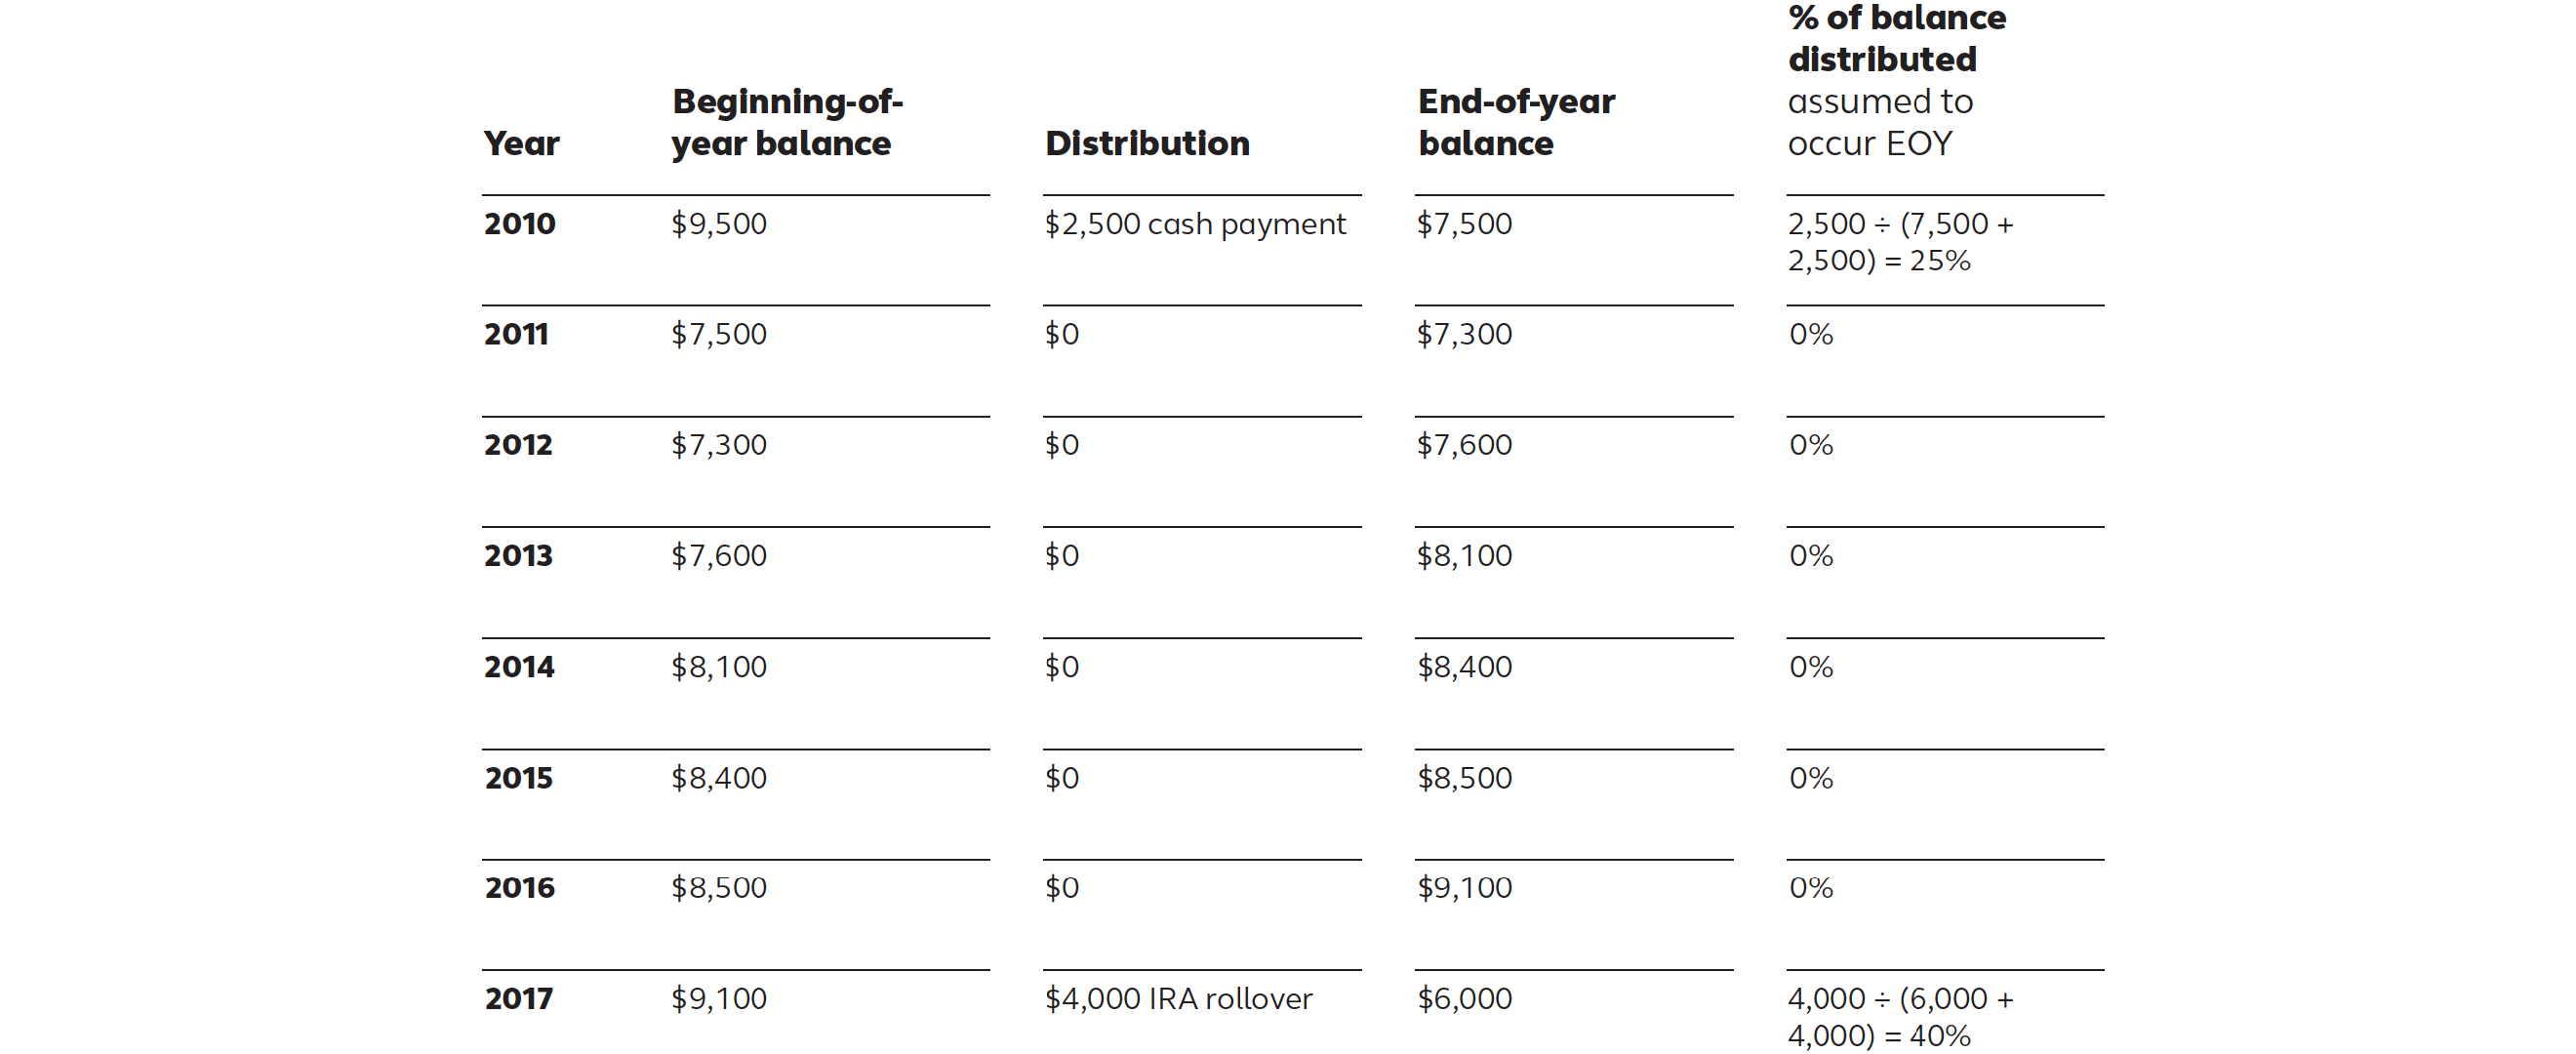
Example: Roger terminated in 2010. He took a cash distribution in 2010 and an IRA rollover in 2017.
Step 1
Total % remaining in the plan = (1 - 25%) * (1 - 40%) = 45%
Step 2
Total % distributed over time = 1 - 45% = 55%
Step 3
Dollars distributed over time = 1/1/2010 balance * total % withdrawn over time ($9,500 * 55% = $5,225)
Step 4
Grossed up cash payment versus rollovers. Cash distribution = (25% ÷ 65%) * $5,225 = $2,010; rollover = $3,215
Roger’s percentages
45% of money remains in the plan, 34% of money was rolled over and 21% was cash payment.
1. https://www.metlife.com/content/dam/microsites/institutional-retirement/pdf/Opportunity-For-Lifetime-Income-8-2017.pdf
2. See, for example, Cerulli Associates, The Cerulli Report US Retirement End-Investor 2018: IRA Owners and 401(k) Plan Participants, where it was determined that 25% of all eligible DC plan dollars in 2017 were rolled over to IRAs.
3. Figure includes participants who remained in the plan but took installments, dividends or required minimum distribution payments of less than 20% of their balance.
4. Excludes participants who took a required minimum distribution as their first withdrawal.
5. The Cerulli Report, US Retirement End-Investor 2018: IRA Owners and 401(k) Plan Participants
6. Vanguard, Retirement distribution decisions among DC participants, October 2016
7. GAO, 401(k) Plans: Labor and IRS Could Improve the Rollover Process for Participants, GAO-13-30
8. For more, see B of A, Merrill, Fidelity Lead the Pack With 401(k) Rollovers: Survey, Ignites, August 22, 2018
9. Assumes a 6% annual return on investment.
